

You open your app and see one of today’s football match predictions: a 2-0 forecast. You load your slip with a smile. Ninety minutes later the underdog nicks a late equaliser, the “sure pick” is gone, and you are left wondering what went wrong. The truth is that strong football match predictions are built on data layers most bettors never see, and learning to read them well is the difference between guessing and making genuinely informed decisions.
At Kcpredict, our analysts publish model-backed football match predictions daily across global leagues. We pair predicted scores with confidence ratings and a clear match preview and forecast so you can see the reasoning behind each tip. In this guide you will learn the inputs we use, the metrics that matter, how to read a predicted score alongside markets like 1X2 and over/under, how to compare picks with bookmaker odds to find value, and how to apply everything responsibly.
What data actually powers a football match prediction
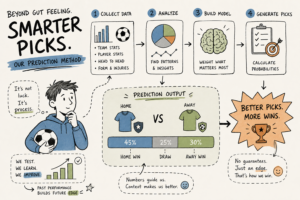
Behind every predicted score or 1X2 tip sits a structured data pipeline. The goal is not to guess the future but to turn noisy match information into clean probabilities. Strong models blend form, availability, context, and market signals, then project a scoreline that best represents the most likely story of the game. Get any one of those layers wrong and the whole forecast shifts.
Team form, head-to-head records, and squad availability
Recent form over the last several fixtures typically carries more weight than season-long averages. It captures tactical tweaks, manager changes, and fitness peaks that longer windows tend to blur. Head-to-head history helps most when it is competition-specific and recent, since styles and coaching setups change quickly. Injury and suspension news can shift the whole picture: remove a team’s primary finisher and a 2-1 projection can tighten to 1-1 as chance conversion drops and scoring variance rises, think of it as an illustrative guide to how significantly one absent player can move the numbers.
For a deeper look at how injuries and suspensions influence team performance, see this analysis on the broader effects of absences and their impact on match projections: understanding football injuries and suspensions.
League context and home/away splits
Home and away performance can be night and day, especially in leagues with heavy travel or intense atmospheres. Models adjust for venue and travel fatigue, and they factor in schedule congestion for continental fixtures. League-table pressure also matters: a mid-table side safe from relegation behaves differently from a team chasing a top-four finish. Context sharpens raw statistics into real match expectations in ways that a simple league table rarely shows.
Odds movement and market signals
Opening lines and line movement provide a live read on new information and sharp money. We convert bookmaker prices into implied probabilities, then compare them to the model’s view to check alignment. Implied probability is a data input as well as an output, because markets react quickly to team news, weather updates, and travel disruptions that have not yet fully flowed into statistical databases.
Which metrics most accurately predict match results
Once raw data is collected, the analytical layer decides which numbers deserve trust. Not all statistics point in the same direction, and some popular fan favorites mislead more than they guide. We focus on chance quality and prevention, not just ball control.
Why xG outperforms raw shot counts and possession stats
Expected goals, xG, estimates the quality of each chance by answering a specific question: how often does a shot like this become a goal, based on location, angle, body part, and context? A team can take 20 low-quality shots and still trail a side that creates just three high-value looks. Possession percentage looks impressive on a broadcast but is a weak standalone predictor of results. Analytics research consistently shows that high possession paired with low xG tends to end in stalemates or surprise defeats, which is exactly why xG has become a cornerstone metric across professional clubs and prediction models alike.
Expected goals conceded and defensive form as a combined signal
Expected goals conceded, xGC, captures the danger a team allows, and it outperforms raw goals-against figures because it filters out finishing luck and goalkeeping hot streaks. Combining a team’s attacking xG with the opponent’s xGC produces a cleaner projected score range. If you want an accessible shortcut without a full model, track shots-on-target differential alongside recent xG trends. Attack plus prevention together tell the real story of likely outcomes far better than either metric alone.
How to interpret predicted scores and confidence ratings
A predicted score is an anchor for probability, not a promise. Reading it correctly helps you map forecasts to betting markets without falling into the trap of treating a projection like a guarantee. Think in ranges and likelihoods, not certainties, that shift in mindset alone will change how you use every football match prediction you read.
What a predicted scoreline actually means
When you see 2-1, the model is saying that outcome is the single most likely result given current data. It is not saying 2-1 happens more than half the time, and it is not ruling out 1-0 or 2-0 as live alternatives. Football is volatile, and a set piece, red card, or penalty can flip the script in minutes. Treat the scoreline as the centre of gravity for the match, with nearby scores sitting close in probability.
Reading 1X2 picks, BTTS, and over/under forecasts alongside the scoreline
A 2-1 home projection typically supports Home on 1X2, BTTS: Yes, and Over 2.5. A 1-0 projection leans Home on 1X2, BTTS: No, and Under 2.5. Use the score to cross-check any football betting tips you encounter: if someone tips Under 2.5 where the forecast centres on 2-1 or 2-2, the logic is inconsistent. Align your market selection to the narrative the predicted score implies, and you will immediately spot tips that contradict their own reasoning. For focused guidance on goal-based markets you can also review specific advice for Over 1.5 goals predictions to see how score projections map to simple goal thresholds.
What confidence levels and ratings tell you
Confidence reflects how strongly the model’s read holds after blending form, xG, context, and market signals. Think of it as a certainty rating: high confidence on a short-priced favourite speaks to reliability but not necessarily value. High confidence on a medium-priced outcome points to a possible edge, though it still needs an odds check before you act. Use confidence to size your attention, then use price to decide on action.
Comparing model picks against bookmaker odds to find value
Moving from “this looks right” to “this is worth a stake” means comparing your forecast to the market. Value appears when your probability for an outcome is higher than the bookmaker’s implied probability. Price creates or kills edge, a great prediction at the wrong odds is still a poor bet.
Implied probability vs. model probability: spotting the gap
To convert decimal odds to implied probability, divide 1 by the odds and multiply by 100. For example, 2.00 implies 50%, 1.80 implies roughly 55.6%, and 2.50 implies 40%. If your model puts the home win at 60% but the sportsbook price implies 50%, you have a 10-point edge worth serious consideration. That gap is where long-term profitability lives.
When to follow a prediction and when to pass
Strong model confidence combined with a market price that undervalues the same outcome is a green light. If the market already prices your pick at very short odds with no meaningful probability gap, expected value is thin even if the selection feels safe. Passing on low-edge plays is actually a winning habit, not a missed opportunity. Discipline beats action bias over a long season.
- Get your model probability for each key market, starting with 1X2.
- Convert sportsbook odds to implied probability and note the bookmaker margin.
- Stake only when your edge is positive and meaningful after accounting for that margin.
Where to get reliable daily football match predictions
If you are wondering where to find football match predictions you can trust, start with platforms that publish transparent logic and trackable results. Kcpredict is built by analysts who post daily forecasts with predicted scores, 1X2 picks, and confidence ratings across competitions including the EPL, Champions League, and top African leagues. We publish historical outcomes so you can review past performance rather than rely on cherry-picked wins, check the results archive directly to see the track record for yourself.
What Kcpredict publishes and how it is updated
Our slate covers international and local tournaments with clear match tips, a quick match preview and forecast, and the key statistics that drive each call. We update forecasts to reflect late injury news, suspensions, and market movement that signals material information. Our format is designed to be straightforward to use alongside common Nigerian bookmakers such as Bet9ja, SportyBet, or 1xBet, so you can map selections to available odds without guesswork.
How to use Kcpredict picks alongside your own analysis
Treat Kcpredict as your starting point, not the final word. Check the predicted score and certainty rating, skim the form and availability notes, then compare with live prices on your preferred book. If the price and the model align around a sensible edge, consider a stake; if not, pass and move to the next match. This workflow turns daily football match predictions into clear, repeatable decisions rather than gut-feel gambles.
- shortlist 3 to 5 matches with medium or high confidence.
- Cross-check team news and travel context, then compare our projection to market prices.
- Record your pick, odds, and stake so you can measure results over time.
Using predictions responsibly without blowing your bankroll
Good football betting tips help, but bankroll discipline keeps you in the game long enough to realise your edge. Variance is part of football, and even well-reasoned forecasts lose in the short run. Your staking plan is your seatbelt, it will not stop every loss, but it will keep one bad week from ending your season.
Bankroll management basics every bettor needs
Use a flat or percentage stake, typically 1 to 3% of your bankroll per pick. This protects you from deep drawdowns when a refereeing decision or goalkeeping error flips a result. Advanced bettors sometimes use a fractional Kelly approach when they have a quantified edge, but even then they scale it down to limit swings. The key is consistency and resisting the temptation to double stakes after losses. For practical staking methods and guidance on sensible sizing, see this primer on bankroll management.
The right mindset for following match tips
Forecasts are informed guides, not guarantees. Give any approach a real sample size, industry practice generally suggests at least 50 to 100 bets, before you judge accuracy, because smaller samples are dominated by short-term variance. Track ROI rather than just hit rate, and review whether you respected price and edge on every selection. The objective is better long-term decisions, not winning every single slip.
Conclusion
Strong football match predictions are built on form, availability, xG, context, and market signals working together. A predicted score tells the most likely story of a match, a confidence rating shows how firmly the model believes that story, and the price then decides whether the story is worth a stake. Get all three aligned and you are no longer guessing, you are making structured, evidence-based decisions.
If you want daily analyst-backed football match predictions you can put to work, check today’s slate on Kcpredict. Use the forecast, confirm the news, compare the odds, and stake within your plan. Do that consistently and you will move from simply following tips to making sharper, value-driven decisions every week.